Voyatek helps institutions understand and use their data to make better decisions.
Colleges and universities are charged with increasing accountability for student outcomes, while demonstrating value in the face of rising costs and student debt. Data-savvy institutions confront these challenges with targeted strategies supported by analytics.
Our focus is helping our higher education clients develop a clear line-of-sight between their strategic goals and day-to-day operations. We design and build customized analytics platforms to support data visualization, forecasting, and data informed decision making; and understand the importance that institutional culture and business processes also play in the success of your analytics strategy.


Higher Ed Success Stories & Insights


Student Success Analytics
Voyatek’s SSA Cloud analytics solution supports your targeted strategies with on-demand analytics that deliver accurate insights for real-time decision making. SSA Cloud brings together all of your institution’s data to create a more complete picture of the student lifecycle and institutional health.
With both a strategic view for administrators, and an operational view for departments, SSA Cloud’s dashboards help you focus enrollment management initiatives, advance equity in student success, and monitor institutional health. Our solution also reduces the burden on IT by supporting automation of analysis and data integration in a stable and reliable infrastructure.
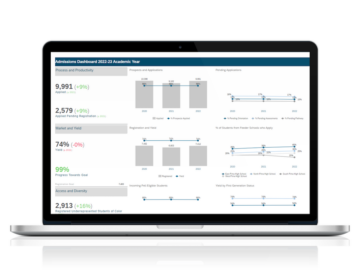
Admissions and Enrollment
Admissions and enrollment are key factors that drive institutional revenue and annual budgets. This area of analysis provides a comparison of applicants’ progress through the admissions funnel; enrollment counts; and change across multiple student demographic and academic attributes. Longitudinal analysis is provided for comparison of an entry cohort or other specifically defined cohorts over time. Our robust data model is designed to support analysis and forecasting to address these business questions and more:
- How many applicants and enrollments did we have at this point in time last year? Based on previous years, what can we expect to achieve this year? How do we identify declining enrollment trends so we can take action?
- What is our projected tuition revenue based on admissions and enrollment projections? What are the trends in revenue segmentation?
- What is our yield rate and is it changing by target market segment or recruiting strategy?
- Are recruiting and marketing events working and which ones have greater impact on yield than others?
- What is our feeder school market share and is it changing from our goals?
Financial Aid
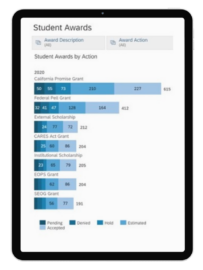 We’ve developed financial aid dashboards that focus on key metrics to support student-centered funding, target awarding efforts, and improve access and affordability for diverse student populations. This cloud-based solution presents insights into operational and strategic outcomes for managing FA applications, awarding aid, and enhancing analysis of special populations to identify unmet need. This comprehensive approach to financial aid data and analysis was developed by request from college financial aid directors and their teams.
Use cases include:
- Target outreach to students based on specific attributes, processing statuses, and awards
- Drill to student and award detail for identified populations
- Analyze application trends to inform staffing needs and monitor progress toward goals
Fraud Detection
To protect our clients’ institutional assets and student funding, ASR developed SSA Cloud Financial Aid with Fraud Detection. This solution helps institutions flag and monitor potentially fraudulent aid applications before funds are awarded and disbursed to scammers.
Our continuously evolving fraud detection model was developed to keep pace with the ever-changing fraud schemes. By utilizing a machine learning algorithm, the model incorporates multiple variables, including application origin and student contact information, to flag potentially fraudulent aid applications. The dashboards optimize institutional awards to eligible applicants; identify FA applicants who are missing key documentation and help nudge them toward file completion; and identify fraudulent applications to ensure that funding is provided to real students with need.
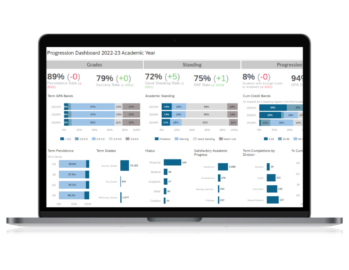
Retention and Completion
The SSA Retention and Completion module helps you track student degree progress, graduation, and transfer patterns. It streamlines regulatory reporting and integrates data from third-party systems such as National Student Clearinghouse, learning management systems, and early alert, among others. It addresses business questions such as:
- Which programs appear to contribute to or impede student success? Where are the bottlenecks and chokepoints for students in particular programs?
- What are our retention rates, and who are our at-risk students?
- Where do students transfer? Attend graduate school?
- What are our trends in credit momentum? What percentage of students are completing 15 credits in their first term, and 30 credits in their first year?
- What courses are students using to satisfy general education courses? What remaining coursework do students have to complete, and how can we use this to forecast demand and drive course offerings?
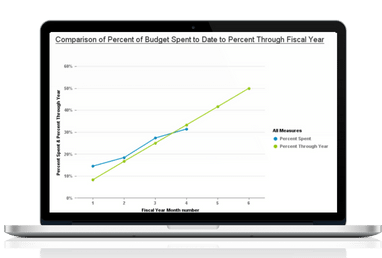
Finance
Understanding the state of finances is critical to the health of the institution. SSA Finance Analytics provides general ledger and purchasing information with current balances compared to budget, committed outlay, and comparisons to prior month and year periods to help you gain insights into specific departmental budgets or expense categories and identify spending patterns. This data is used to address business questions such as:
- What is the trend in budget to actual expenditures with year-over-year comparison of variance? Are we on track to be within budget for the current fiscal year?
- Where do we have opportunities to streamline purchases or combine spending into larger bulk orders, to negotiate lower prices and save money?
- What is the trend in bad debt over the last five fiscal years? What are the sources of bad debt?
- What reports do we need to prepare for auditors, such as registration charges, tuition rate tables, total payments to vendors, check registers, and PO statuses?
Human Resources
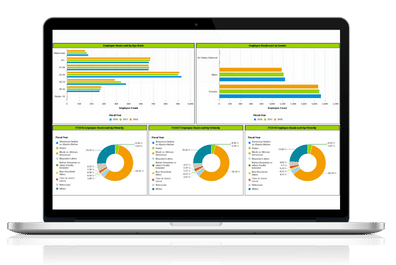
SSA Human Resources organizes position, wage, and benefits information to provide a clear picture of year-over-year employee data, including demographics, position classes, employee expenditures, and retention and turnover rates. This module simplifies the process of identifying active employees over time, allowing you to automate operational and strategic reports to address business questions such as:
- How are employee demographics changing over time? Do they reflect the demographics of our student body and community?
- What are our employee retention, turnover, and retirement rates by fiscal year, academic year, and month to month? Could any of these affect our ability to deliver the academic and student services necessary to achieve our goals?
- What is our expenditure rate by employee category or by individual employee?
- Which employees are at risk of leaving and what factors should be prioritized for employee retention efforts?
Guided Pathways
There is no “one size fits all” solution for colleges implementing Guided Pathways.
Your student population, organizational culture, and information systems are all unique. Our methodology and approach to Guided Pathways leverage the technology and data that you already have in place to better understand your students’ success and risk factors. This perspective reduces implementation time and cost and minimizes the learning curve for faculty and staff, so they can focus on serving your students.
Our custom data models and depth of experience integrating and applying data provide the information you need to:
- discover the driving forces and goals behind your institution’s commitment to Guided Pathways
- align academic and co-curricular programs with economic opportunities and student needs
- guide students toward resources that will ensure their success, and provide advisors with leading indicators to help monitor students and keep them on path, e.g. developmental education placement, enrollment, credit momentum, and completion rates
- inform advisors with leading indicators and measure the success advising processes and intervention initiatives
- analyze LMS outcomes for mastery of core general education competencies
- Admissions & Enrollment
-
Admissions and Enrollment
Admissions and enrollment are key factors that drive institutional revenue and annual budgets. This area of analysis provides a comparison of applicants’ progress through the admissions funnel; enrollment counts; and change across multiple student demographic and academic attributes. Longitudinal analysis is provided for comparison of an entry cohort or other specifically defined cohorts over time. Our robust data model is designed to support analysis and forecasting to address these business questions and more:
- How many applicants and enrollments did we have at this point in time last year? Based on previous years, what can we expect to achieve this year? How do we identify declining enrollment trends so we can take action?
- What is our projected tuition revenue based on admissions and enrollment projections? What are the trends in revenue segmentation?
- What is our yield rate and is it changing by target market segment or recruiting strategy?
- Are recruiting and marketing events working and which ones have greater impact on yield than others?
- What is our feeder school market share and is it changing from our goals?
- Financial Aid
-
Financial Aid
We’ve developed financial aid dashboards that focus on key metrics to support student-centered funding, target awarding efforts, and improve access and affordability for diverse student populations. This cloud-based solution presents insights into operational and strategic outcomes for managing FA applications, awarding aid, and enhancing analysis of special populations to identify unmet need. This comprehensive approach to financial aid data and analysis was developed by request from college financial aid directors and their teams.Use cases include:
- Target outreach to students based on specific attributes, processing statuses, and awards
- Drill to student and award detail for identified populations
- Analyze application trends to inform staffing needs and monitor progress toward goals
Fraud Detection
To protect our clients’ institutional assets and student funding, ASR developed SSA Cloud Financial Aid with Fraud Detection. This solution helps institutions flag and monitor potentially fraudulent aid applications before funds are awarded and disbursed to scammers.
Our continuously evolving fraud detection model was developed to keep pace with the ever-changing fraud schemes. By utilizing a machine learning algorithm, the model incorporates multiple variables, including application origin and student contact information, to flag potentially fraudulent aid applications. The dashboards optimize institutional awards to eligible applicants; identify FA applicants who are missing key documentation and help nudge them toward file completion; and identify fraudulent applications to ensure that funding is provided to real students with need.
- Retention & Completion
-
Retention and Completion
The SSA Retention and Completion module helps you track student degree progress, graduation, and transfer patterns. It streamlines regulatory reporting and integrates data from third-party systems such as National Student Clearinghouse, learning management systems, and early alert, among others. It addresses business questions such as:
- Which programs appear to contribute to or impede student success? Where are the bottlenecks and chokepoints for students in particular programs?
- What are our retention rates, and who are our at-risk students?
- Where do students transfer? Attend graduate school?
- What are our trends in credit momentum? What percentage of students are completing 15 credits in their first term, and 30 credits in their first year?
- What courses are students using to satisfy general education courses? What remaining coursework do students have to complete, and how can we use this to forecast demand and drive course offerings?
- Finance
-
Finance
Understanding the state of finances is critical to the health of the institution. SSA Finance Analytics provides general ledger and purchasing information with current balances compared to budget, committed outlay, and comparisons to prior month and year periods to help you gain insights into specific departmental budgets or expense categories and identify spending patterns. This data is used to address business questions such as:
- What is the trend in budget to actual expenditures with year-over-year comparison of variance? Are we on track to be within budget for the current fiscal year?
- Where do we have opportunities to streamline purchases or combine spending into larger bulk orders, to negotiate lower prices and save money?
- What is the trend in bad debt over the last five fiscal years? What are the sources of bad debt?
- What reports do we need to prepare for auditors, such as registration charges, tuition rate tables, total payments to vendors, check registers, and PO statuses?
- Human Resources
-
Human Resources
SSA Human Resources organizes position, wage, and benefits information to provide a clear picture of year-over-year employee data, including demographics, position classes, employee expenditures, and retention and turnover rates. This module simplifies the process of identifying active employees over time, allowing you to automate operational and strategic reports to address business questions such as:
- How are employee demographics changing over time? Do they reflect the demographics of our student body and community?
- What are our employee retention, turnover, and retirement rates by fiscal year, academic year, and month to month? Could any of these affect our ability to deliver the academic and student services necessary to achieve our goals?
- What is our expenditure rate by employee category or by individual employee?
- Which employees are at risk of leaving and what factors should be prioritized for employee retention efforts?
- Guided Pathways
-
Guided Pathways
There is no “one size fits all” solution for colleges implementing Guided Pathways.
Your student population, organizational culture, and information systems are all unique. Our methodology and approach to Guided Pathways leverage the technology and data that you already have in place to better understand your students’ success and risk factors. This perspective reduces implementation time and cost and minimizes the learning curve for faculty and staff, so they can focus on serving your students.
Our custom data models and depth of experience integrating and applying data provide the information you need to:
- discover the driving forces and goals behind your institution’s commitment to Guided Pathways
- align academic and co-curricular programs with economic opportunities and student needs
- guide students toward resources that will ensure their success, and provide advisors with leading indicators to help monitor students and keep them on path, e.g. developmental education placement, enrollment, credit momentum, and completion rates
- inform advisors with leading indicators and measure the success advising processes and intervention initiatives
- analyze LMS outcomes for mastery of core general education competencies

The First Student-Controlled Decentralized Identity Platform Designed for Higher Education
Voyatek’s Decentralized Identity solution enables higher education institutions to authenticate student identity without putting their privacy at risk. Our solution allows students to have complete control over their identities and personal data, while giving institutions the information they need to validate data relevant to financial aid, admissions and course credit.
By putting the student in control of their own data, Voyatek’s Decentralized Identity solution:
- Strengthens Security: Educational institutions no longer need to store students’ personally identifiable information (PII), thus reducing the risk of data theft or cyber-attacks.
- Prevents Fraud: Students’ information is validated via a public ledger and shared through tamper-proof communication channels, making application or financial aid fraud nearly impossible.
- Reduces Costs: Significantly decrease the amount of time, resources, and funds dedicated to verifying student information or issuing credentials related to course credit, test scores, etc.
- Promotes Equity: Students can verify identity with a variety of credentials, not just government-issued IDs, and identity proofing occurs without revealing or storing any data related to demographics, thus reducing potential bias in application or financial aid processing.
How it Works
